

Ontario and U.S. corn and soybean production estimates have been raised since last month. Statistics Canada released its satellite model crop estimates based on conditions in late August.
The Ontario corn yield was raised by 9.7 bu./acre from the August release and Statistics Canada trimmed the Ontario soybean estimate but it is important to realize the model-based yield estimate can be misleading in areas where the crop was further advanced.
Private estimates and our contacts report record soybean yields. There could be storage issues, which would cause Ontario basis levels to deteriorate. Spring wheat and winter wheat yields were unchanged from earlier projections but Statistics Canada made a sharp downward revision to Western Canadian spring wheat yields.
Read Also
Packer buys Green Giant, Le Sieur veg brands from U.S. owner
A Quebec-based processor’s deal to buy the Green Giant and Le Sieur packaged and frozen vegetable brands in Canada from a U.S. owner clarifies the status of two popular retail brands grown by Canadian farmers.
Quick look
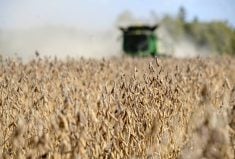
Soybeans: StatsCan reduced its yield projections, however field and crop tours place the yield projections much higher.
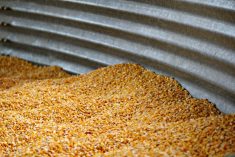
Corn: StatsCan estimated the Ontario corn yield at 179.1 bu./acre on its August survey, up from the July survey of 169.4 bu./acre.
Wheat: Winter wheat production was left unchanged at 2.6 million tonnes, up from the 2020 output of 2.3 million tonnes.
The U.S. Department of Agriculture raised its corn and soybean production estimates on the September World Agriculture Supply and Demand Estimates (WASDE). The longer-term forecast calls for above normal temperatures and below normal precipitation for much of the U.S. corn belt, which will allow rapid harvest progress.
Hurricane Ida damaged terminals in the U.S. Gulf, resulting in slower exports. Companies have been hesitant to make additional sales until logistical operations are back to normal. Some Chinese business has been switched to other origins. However, demand remains strong.
The Sept. 17 soybean settlement on China’s Dalian Commodity Exchange was US$19.73 per bu. Traders are watching weather forecasts in South America with seeding in the early stages. We’re forecasting a surge in U.S. soybean export business later in fall.
Macro economic events appear to be driving the Canadian dollar. China appears to be undergoing a price correction in real estate values. A major property holding group in China apparently defaulted in debt payments and no one really knows how widespread this situation is among Chinese companies.
U.S. fiscal policy is negative as Congress needs to increase the debt ceiling over the next month. U.S. monetary policy looks to be somewhat hawkish. All these factors are negative for the resource-based Canadian dollar. Seasonally, the Canadian dollar tends to grind lower during October and November and all the headwinds point to a weaker sentiment.
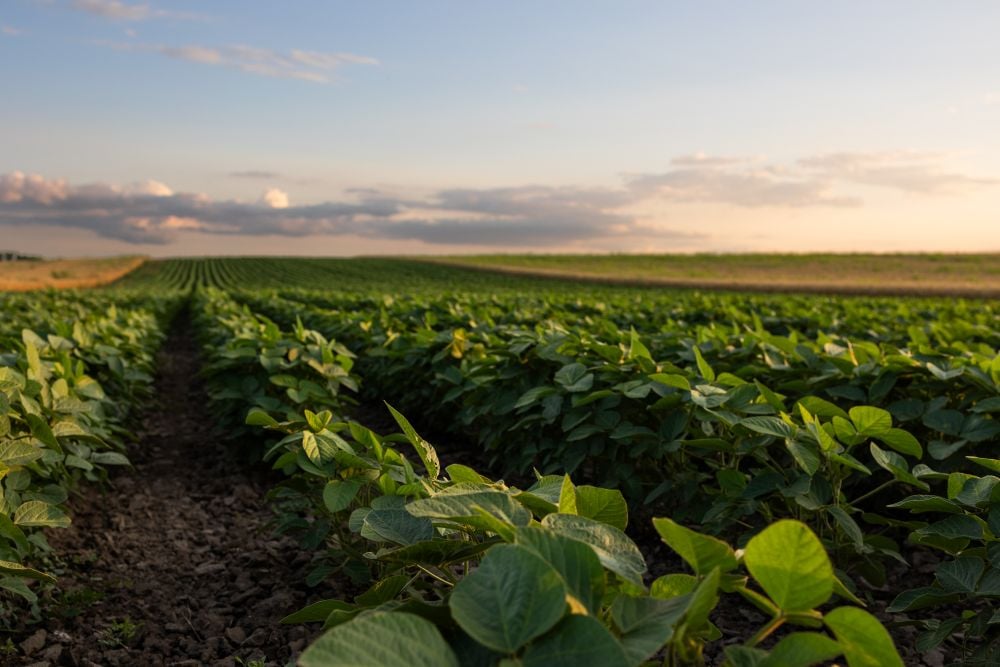
Soybeans
Statistics Canada estimated Ontario soybean yield at 47.7 bu./acre on its August survey, which was down from the July result of 48.3. The satellite model-based survey can be misleading if the crop is further advanced and drying down. Private estimates and crop tours have the soybean yield estimates in the range of 53 to as high as 56 bu./acre.
We’re using an average yield projection of 54.8 bu./acre, which would result in a production number of 4.4 million tonnes. This compares to the current Statistics Canada estimate of 3.8 million tonnes and last year’s output of 3.9 million tonnes. The five-year average for Ontario soybean production is also 3.8 million tonnes. Most farmers report above average yields. This will cause the Ontario basis levels to deteriorate during the harvest period.
The USDA raised its U.S. soybean production estimate to 119 million tonnes on its September report. This compares to the August projection of 118 million tonnes and up from the 2020 output of 113 million tonnes.
Despite the increase in production, the U.S. soybean carryout for the 2021-22 crop year will finish near historical low levels. The market cannot afford a crop problem in South America and the futures market will be extremely sensitive to weather developments.
China has been actively buying soybeans for nearby and deferred positions. U.S. soybeans are most competitive on the world market. However, logistical problems out of the Gulf have resulted in China buying higher priced soybeans from Brazil.
Soymeal and soyoil futures have been under pressure with the U.S. harvest right around the corner. There is strong competition for products on the export market so Ontario crush margins are struggling in the short term. The Ontario soybean crush is based on cash values for the products in the domestic market. Offshore movement for Ontario soybeans will increase in November and December. This is a period of seasonally strong demand for Ontario soybeans and will be a good opportunity to make our next sales recommendation.
What to do: We’ve advised farmers to be 20 per cent sold on their 2021 production. We’re planning to make our next sales recommendation in late October or early November. In the short term, look for harvest pressure on the futures and we expect basis deterioration in Ontario due to the larger crops. Later in fall, the soybean futures market will likely incorporate a risk premium due to the uncertainty in South American production. Our strategy is to sell into this strength.
Corn
Statistics Canada estimated the Ontario corn yield at 179.1 bu./acre on its August survey, up from the July survey of 169.4 bu./acre and sharply above the five-year average of 162.3 bu./acre. We agree with Statistics Canada as its satellite model-based survey confirms reports from our Ontario contacts.
Private crop estimates are higher than Statistics Canada but we tend to take a wait and see approach when the yield estimates are over two standard deviations above the five-year average. There will be on-farm storage issues. There is no doubt about it. Basis levels will come under pressure through the harvest period and the Ontario corn market will function to encourage demand.
The USDA raised its U.S. corn production on its September survey to 381 million tonnes. This is up from the August estimate of 375 million tonnes and up from the 2020 output of 360 million tonnes. U.S. ethanol use is slowly edging higher. Domestic feed demand makes a seasonal high during the winter. U.S. export sales commitments are up 20 per cent from last year. At this stage, the stronger demand will easily offset the year-over-year increase in production.
The risks moving forward are two-fold. First, Chinese buying has been quiet since May. Port delays and logistical congestion, adverse weather and financial problems come on the heels of last year’s food shortage. Chinese import demand for 2021-22 is expected to be similar to last year.
Secondly, South America has historically tight corn stocks. Similar to soybeans, the corn market will be extremely sensitive to Argentine and Brazil crop developments. In any case, the export surplus from Argentina will only be available in March. Brazil supplies will only be available next May.
What to do: We have advised producers to be 20 per cent sold on their 2021 production. Our next sales recommendation will likely occur in November. Domestic feed demand and ethanol usage will increase in the winter. Ontario exports will move into high gear after harvest. If dryer conditions develop in South America, this could spur buying from major importers, including China.
Wheat
Statistics Canada made no changes to winter or spring wheat production on its August survey. Winter wheat production was left unchanged at 2.6 million tonnes, up from the 2020 output of 2.3 million tonnes. Spring wheat production was left at 149,500 tonnes, up from the 2020 crop size of 146,900 tonnes.
Since July, Ontario soft red winter wheat prices have been hovering in a 40 cent/bu. range of $7.80-$8.20/bu. When a market trades in a range for a long period and then breaks out of this range, there is usually a significant move.
We have a friendly outlook from a fundamental perspective although recent macro events could temper the upside. Soft red milling wheat supplies in Ontario and the U.S. are down from year-ago levels due to adverse weather during harvest. We now estimate that 25 to 30 per cent of the Ontario and U.S. soft red winter wheat production is milling quality.
Statistics Canada estimated total Canadian spring wheat production at 15.3 million tonnes, down from the July survey of 16.1 million tonnes. We’re estimating Canadian spring wheat production around 14 million tonnes. We don’t believe the satellite survey considered the acreage that was used for forage or abandoned.
There were many fields in Saskatchewan and south of Calgary where farmers didn’t start a combine or grease up a baler. We’ll only have an idea of actual unharvested area on the final November survey, which will be released Dec. 3.
Milling wheat supplies in Europe are also down from year-ago levels due to adverse rains in France during the main harvest period. Germany also had some regions where quality was downgraded. Ukraine and Russia generally sell over half of the wheat in the first half of the marketing year. The selling pressure is not as severe this year with the Russian export tax in place, which changes on a weekly basis. Russian farmers are choosing to hold onto their crop longer.
U.S. winter wheat farmers sell nearly 50 per cent of their wheat in the summer and this selling pressure is over. The wheat market has breathing room to move higher. Traders are also monitoring winter wheat seeding in the U.S., Russia and Ukraine. Russia is on the dryer side and more precipitation is needed.
What to do: We’ve advised producers to be 20 per cent sold on their 2021 wheat production. The wheat market tends to make a seasonal high in late October or early November prior to the main Australian harvest. We’re watching this timeframe for the next selling opportunity. If they have feed quality wheat, we’ve advised producers to be 30 to 50 per cent sold. The larger corn crop and abundant feed wheat supplies will weigh on the market.