
Most of the Ontario growing region received less than 40 per cent of normal precipitation during August. Isolated regions received normal precipitation but these areas were the exception.
Quick look:
Soybeans: Ending stocks will swell if the United States doesn’t make a trade with China within the month.
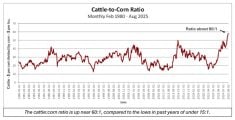
Corn: We’re forecasting an Ontario corn crop of 9.6 million tonnes, unchanged from 2024.
Wheat: Supplies will decrease in the latter half of the crop year resulting in a stronger basis.
Read Also
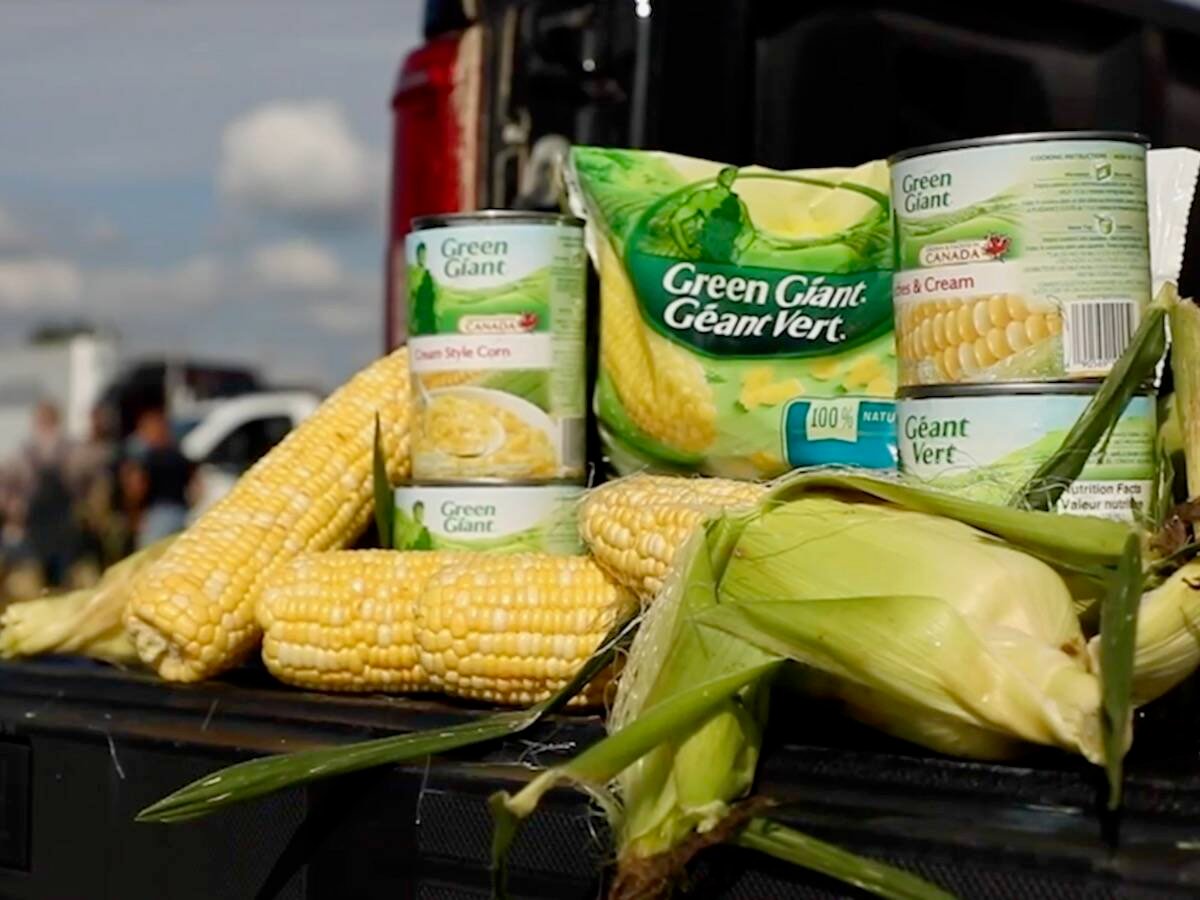
Packer buys Green Giant, Le Sieur veg brands from U.S. owner
A Quebec-based processor’s deal to buy the Green Giant and Le Sieur packaged and frozen vegetable brands in Canada from a U.S. owner clarifies the status of two popular retail brands grown by Canadian farmers.
August temperatures were one to two degrees above normal across the province. Ontario corn and soybean crops continue to experience yield drag resulting in lower production estimates compared to our last issue. There are no changes to the U.S. production estimates. We believe the wheat market is in the process of making seasonal lows.
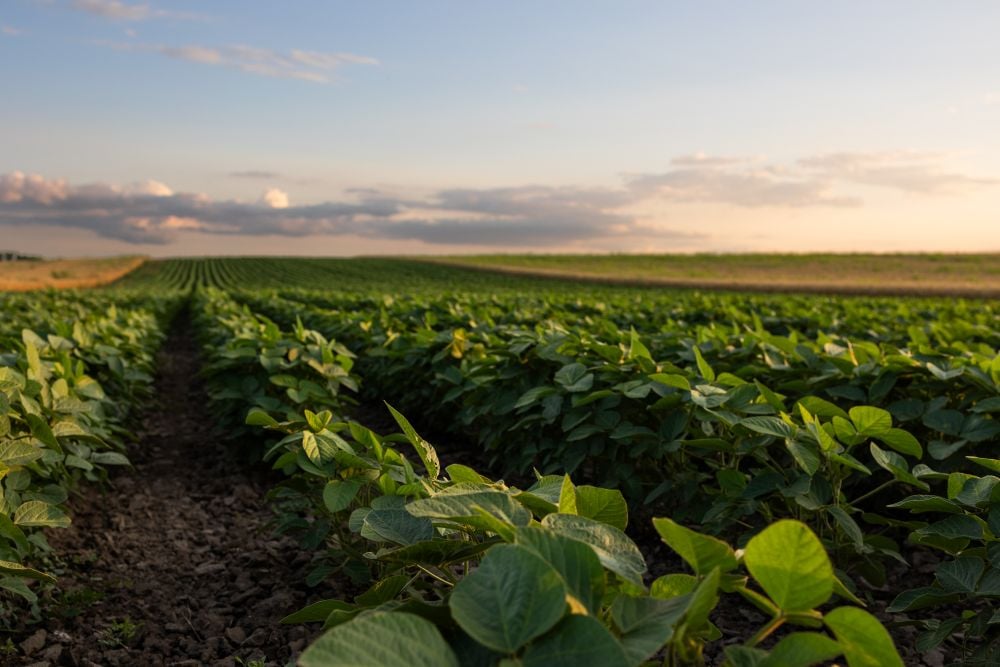
Soybeans
We’re now estimating an Ontario soybean crop of 3.7 million tonnes, down from the 2024 output of 4.3 million tonnes. Ontario farmers will sell 70 per cent or 2.6 million tonnes of soybeans in the first four months of the crop year.
The domestic crush is estimated 510,000 tonnes. There is a fair amount of uncertainty regarding Chinese demand for Ontario soybeans. There is no official tariff on Canadian soybeans.
At the time of writing this article, U.S. soybeans were offered at US$409/tonne f.o.b. the Gulf, while Brazilian soybeans were valued at US$438/tonne f.o.b. Paranagua. Ontario soybeans were offered at US$405/tonne f.o.b. St. Lawrence port.
China has not bought U.S. soybeans for new crop positions despite the sharp discount to Brazilian origin. The bulk of Chinese purchases for September through December have been from Brazil. Talk in the trade is that China has bought Canadian soybeans, but we’re not sure of the volume and how much is actually from Ontario.
In late August, U.S. and Chinese officials were discussing trade issues and trying to come to agreement. The window is closing for fall purchases when the U.S. has a price advantage over Brazil. If there is a U.S.-China trade deal, this would lift North American soybean prices. We haven’t been aggressive on sales because we’ve been waiting for this agreement.
The USDA estimated the U.S. soybean crop at 116.8 million tonnes. Private trade estimates are surfacing around 120 million tonnes. This is up from last year’s crop of 118.8 million tonnes.
If the U.S. does not make a trade deal with China over the next month, the export projection will be taken down and the ending stocks will swell. China sets the price structure because they are the largest importer.
What to do: We’ve advised farmers to be 10-20 per cent sold on their 2025 soybean production. We’re waiting for a U.S.-China trade agreement before making additional sales. Secondly, the Ontario crop may be smaller than our estimate which would be supportive for Ontario prices. We don’t want to make additional sales until farmers know the actual harvested volume.
Corn
We’re now forecasting an Ontario corn crop of 9.6 million tonnes, which is unchanged from last year. This doesn’t change the market outlook for the first half of the crop year but enhances the price upside in the March through June timeframe of 2026.
Farmers are expected to deliver six million tonnes of corn from Sept. 1 through Dec. 31, 2025. Domestic demand is estimated at 2.8 million tonnes while exports are projected to reach 600,000 tonnes. Total demand is about 3.4 million tonnes for the first four months of the crop year.
We continue to have a bearish outlook for the Canadian and world corn market due to the larger U.S. corn crop. We feel comfortable with the USDA’s U.S. crop estimate of 425 million tonnes, up from the 2024 production of 378 million tonnes. The U.S. corn market will function to encourage demand through lower prices.
At the time of writing this article, U.S. corn was offered at US$204/tonne f.o.b. the Gulf, while Brazilian corn was valued at US$204/tonne f.o.b. Paranagua. French corn was quoted at US$218/tonne f.o.b. La Pallice. Ontario corn for Sept was quoted at $224/tonne f.o.b. St. Lawrence port for late September loading and US$200/tonne for November position. Ontario corn is competitive with French origin into Northern Europe for new crop positions.
After the corn market functions to encourage demand in the fall, the market will discourage production. In South America, we’re expecting farmers to decrease corn acres and increase soybean acres this fall. Similarly, U.S. farmers will likely lower corn acres in the spring of 2026. During the 2025 growing season, U.S. conditions were optimal resulting in record yields about nine bu./acre above trend. Next year, yields will not be as high. The fundamentals favour marketing the bulk of the corn crop in the latter half of the crop year.
What to do: We’ve advised farmers to be 20 per cent sold on their expected 2025 production. There is significant downside risk to the corn market over the next three months. Next spring, the corn market will incorporate a risk premium due to the uncertainty in production. Markets will be more sensitive to weather due to the lower planted acreage in South America and the U.S. Demand for Ontario corn makes seasonal highs from March through June.
Wheat
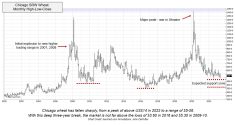
The wheat cash and futures markets have been under pressure over the past month. The Ontario and world markets have been absorbing the northern hemisphere harvest.
U.S. farmers sell about 50 per cent of their winter wheat at harvest while European and Russian farmers sell between 30 to 50 per cent. Ontario farmers also sell 50-60 per cent of crop off the combine.
The U.S. spring wheat harvest will be wrapped up around Sept. 6 while the Canadian and Russian spring wheat harvests will be completed by Sept. 20. After the spring wheat harvests are completed, the wheat complex experiences a seasonal rally.
The cost to carry or store soft red winter wheat from one month to the next is about eight cents/bu. The September and December Chicago wheat spread has been trading around 24 cents which is basically considered “full carry”. When the futures market’s spreads are near full carry, two main factors characterize the market structure.
First, end users have their nearby needs covered and the commercial system is full. There is no demand. When the markets are at full carry, the futures markets tend to trend lower. The basis and the futures deteriorate. If farmers do want to sell at this time, the market is telling the farmer to sell now for deferred delivery.
The March Chicago wheat futures are trading at a 40 cents/bu. premium to the nearby September contract. Farmers can capture about 40 cents/bu. by selling in September for March 2026 delivery.
I want to compare this to the March May Chicago wheat spread which has been trading around nine cents/bu. or 37 per cent of full carry. When the spreads narrow, this reflects a stronger fundamental structure in the deferred positions. Supplies will decrease in the latter half of the crop year resulting in a stronger basis.
What to do: We’re planning on making our first milling wheat sale in mid to late October. The futures markets’ spreads will start to tighten up as supplies start to decrease. This will reflect the stronger basis for the cash market. If you have feed quality wheat, we’ve advised farmers to sell 30 per cent of their production.