
Statistics Canada released its first yield estimates for the 2020 crop using satellite technology on Aug. 31. Soybean yields were lower than expected while corn yields were in line with our projections. Winter wheat production came in at 2.4 million tonnes, the highest output since 2016. Statistics Canada also fine tuned the seeded area while providing the first estimate for harvested acres.
Quick look
Soybeans: U.S. export sales have been exceeding expectations.
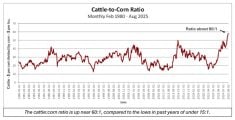
Corn: Ontario corn carryout remains very tight, which should support prices.
Wheat: World demand for higher domestic wheat storage could mean more need for wheat.
Read Also
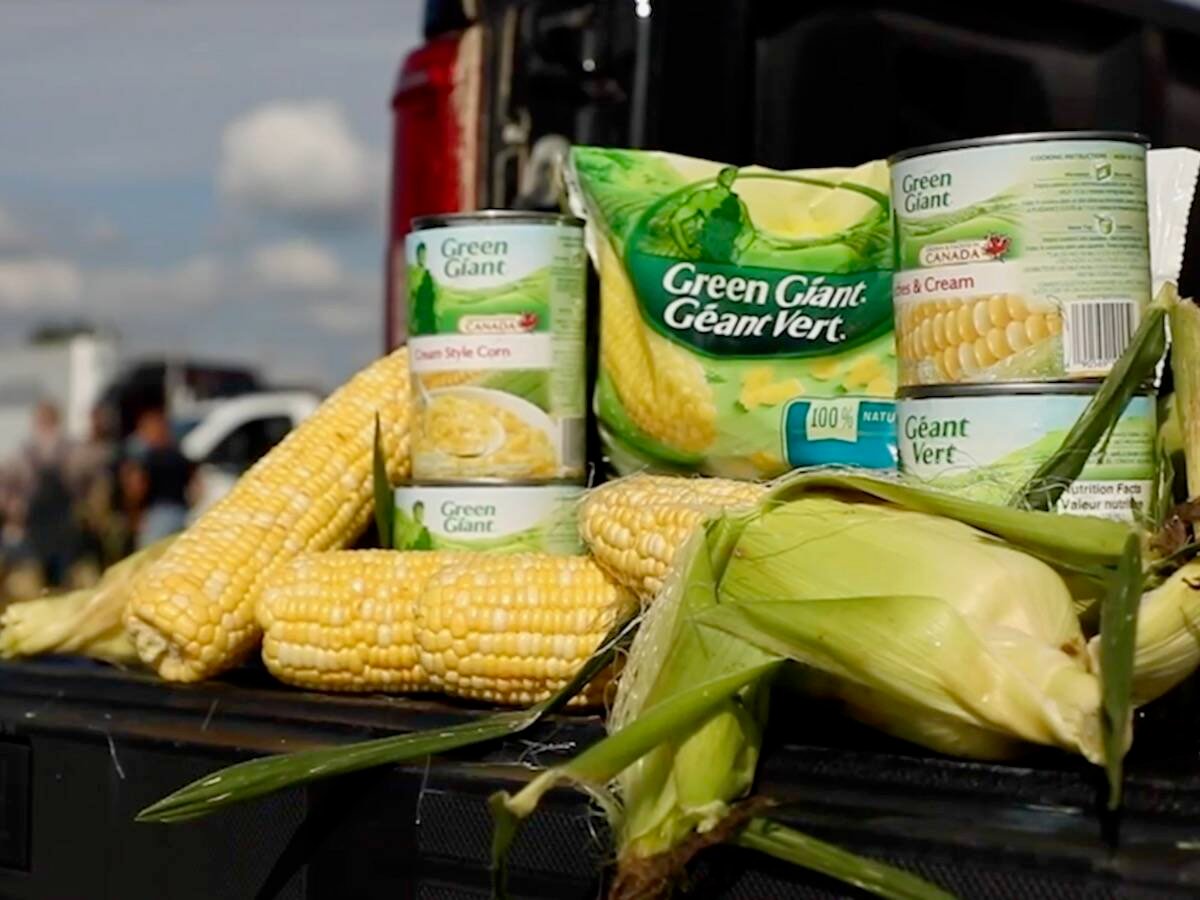
Packer buys Green Giant, Le Sieur veg brands from U.S. owner
A Quebec-based processor’s deal to buy the Green Giant and Le Sieur packaged and frozen vegetable brands in Canada from a U.S. owner clarifies the status of two popular retail brands grown by Canadian farmers.
Precipitation over the past month has been quite variable. The Hamilton-Niagara Falls region has received 40 to 60 per cent of normal precipitation while the area from Hanover to London has received 60 to 85 per cent of average rainfall.
The Ottawa to Toronto and north are saturated with most of this region receiving over 150 per cent of normal precipitation with temperatures two to three degrees below normal. Windsor and surrounding area have experienced average precipitation but temperatures are slightly below normal.
Compared to the third week of August, Ontario elevator bids for corn are up $0.20/bushel to $0.30/bushel and soybean prices are up approximately $0.50/bushel. The corn and soybean markets are incorporating a risk premium due to deteriorating crop conditions in the U.S. At the same time, Chinese demand for U.S. soybeans and corn has contributed to the firmer tone. Winter wheat prices are up $0.10/bushel to $0.20/bushel compared to late August. Ontario wheat basis levels are under pressure due to abundant supplies after the harvest period.
Canadian dollar futures touched a seven-month high in early September but it’s difficult to forecast longer term direction. Economic data reflects that U.S. and Canadian economies have recovered quicker than anticipated; however, federal Liberal fiscal policy is negative while the Bank of Canada monetary policy is considered quite dovish.
During August, U.S. equity markets reached pre-COVID highs but the Canadian S&P/TSX Composite Index had a gap of 1000 points from the February level. Inflation will likely become a major factor over the next four to six months, which should support grain and oilseed prices.
Soybeans
Ontario soybean yields are expected to average 46.1 bushels per acre according to Statistics Canada. This is up two bushels per acre from the 2019 yield and in line with the five-year average. Production is expected to come in at 3.6 million tonnes, down from the 2019 output of 3.7 million and down from the five-year average crop size of 3.8 million tonnes.
It’s important to realize that Statistics Canada tends to be conservative on the first yield estimate. We wouldn’t be surprised to see the crop finish around 3.9 million tonnes.
U.S. soybean conditions continue to deteriorate due to limited precipitation. The U.S. drought monitor map shows that dryer conditions have expanded in Iowa, Illinois and Nebraska; a larger portion of Iowa has experienced severe drought conditions. North and South Dakota are abnormally dry. We want to draw attention to the futures market spreads.
At the time of writing this article, the November-January soybean spread was 5.5 cents per bushel but the January-March spread was 0.5 cents per bushel. The spreads reflect the commercial view of the market or the “smart money.” The narrow January March spread is a bullish signal.
Commercial traders expect soybean supplies to be relatively tight prior to the South American crop coming on the market. U.S. soybean export sales have been exceeding expectations, which has contributed to the stronger basis levels for the winter period.
What to do: Earlier, we advised producers to be 100 per cent sold on old crop and 20 per cent sold on their 2020 production. We’re looking for Ontario export demand to improve (non-China) from October through December. We may also see the U.S. domestic market trade at a premium to export values to limit Canadian imports of U.S. soybeans. We have a friendly view of the soybean market moving forward although producers can expect volatility during the harvest period. The Ontario weather forecast for September calls for above normal precipitation and below normal temperatures. We don’t like to increase sales until the upcoming crop is in the bin.
Corn
Statistics Canada estimated the Ontario corn yield at 159.6 bushels per acre, up from the 2019 average of 158.4 bushels per acre. Production is expected to come in at 8.7 million tonnes, up from 8.6 million tonnes last year and similar to the five-year average, which is also 8.7 million tonnes.
We mentioned in previous issues that the corn carryout from 2019/20 was expected to be historically tight so the market will remain firm until new crop supplies come on the market. We wouldn’t be surprised to see Ontario corn production reach about 8.9 million tonnes because we feel this yield estimate is a bit low.
The corn futures appear to be incorporating a risk premium due to the uncertainty in production. The U.S. corn crop was rated 62 per cent good to excellent as of Aug. 30, down from 72 per cent good to excellent on Aug. 2. Iowa corn conditions dropped from 73 per cent good to excellent on Aug. 2 to 45 per cent on Aug. 30.
Therefore, we’ll likely see downward revisions for the U.S. yield on the upcoming USDA WASDE report. Without going into detail, we’re now looking for the U.S. corn crop to come in at 372 million tonnes, down from the previous USDA estimate of 388 million tonnes but still up from the 2019 output of 345 million tonnes.
U.S. corn export sales for the 2020/21 crop year are exceeding expectations due to Chinese demand. Offers out of the U.S. Gulf are competitive on the world market enhancing offshore movement. We see U.S. corn fundamentals are shaping up so that the 2020/21 carryout finishes near 53 million tonnes, up from the 2019/20 ending stocks of 52 million tonnes but still up from the five-year average of 48 million tonnes. The main point is that it’s not as bearish as earlier in summer when the carryout was expected to reach 69 million tonnes.
What to do: We’ve advised producers to be 100 per cent sold on old crop and 20 per cent sold on new crop. The corn market has experienced a counter seasonal trend by rallying into the harvest period. Ontario exports are expected to improve during the fall period barring adverse weather during harvest. We expect to see strong demand from Europe for Ontario corn. Ontario ethanol production is running about 80 per cent of normal, which is a positive signal as well. We’re planning on making our next sale in late October or early November.
Wheat
Statistics Canada estimated Ontario winter wheat production at 2.4 million tonnes, up from the 2019 output of 1.4 million tonnes and up from the five-year average of 1.9 million tonnes. The Ontario wheat market appears to be functioning to encourage demand in the short term.
World wheat values are up about US$12/tonne from late August but elevator bids in Ontario are only up about US$4/tonne. We’re looking for Ontario wheat exports to increase over the next couple months, which will cause basis levels to improve.
Russia is the largest wheat exporter in the world, therefore, Black Sea export offers for Ukrainian and Russian wheat have a larger influence on the world price structure. On the last Egyptian tender, (one of the largest importers), Russian wheat offers were about US$13/tonne higher than last month.
Another factor to consider is that for U.S. hard red winter and hard red spring wheat, approximately 50 per cent of the demand is for domestic usage. Despite the steady domestic demand, U.S. export sales have been larger than anticipated.
We mentioned in the previous issue that we’re anticipating a drawdown in ending stocks from all major exporters for the 2020/21 crop year. Secondly, the world is no longer comfortable with past stock levels for wheat. We’ve seen how quickly store shelves can empty on a pandemic. The wheat market is still in a COVID hangover. Many world buyers have extended coverage because they don’t want to be in short supply.
The U.S. spring wheat harvest is in the final stages while the Canadian spring wheat harvest was approximately 35 per cent complete as of Sept. 6. The Northern Hemisphere winter wheat harvests are finished and we’re seeing world wheat values percolate higher.
What to do: There is a very strong seasonal tendency for wheat futures to rally from mid September to late October. This is likely when we’ll make our next sales recommendation. We’ve advised producers to be 20 per cent sold on their 2020 production. Be patient to make further sales.