The USDA released its March 1 stocks report March 29 along with the seeding intentions survey.
Stocks reports confirm the 2017 production and, in the case of corn and wheat, provide an idea of domestic feed usage. Stocks reports are not usually market movers.
Market factors this week:
- There’s lots of soybean carryout in the U.S., but planting acreage expectations are down.
- Corn planting acre expectations are also down in the U.S.
- There’s a significant spread between May and July wheat prices, pointing to more sales of old crop in July.
Read Also
Cycle swings dictate farming profitability
It can be profitable to understand where the crop markets are positioned in the context of their big-picture cycles.
The main focus of the report was the seeding intentions survey. This provides our first indication of production potential for 2018. Therefore, this is one of the most important reports of the year. Throughout April and May, the market will digest the acreage intentions report and weather conditions will become more influential in price direction.
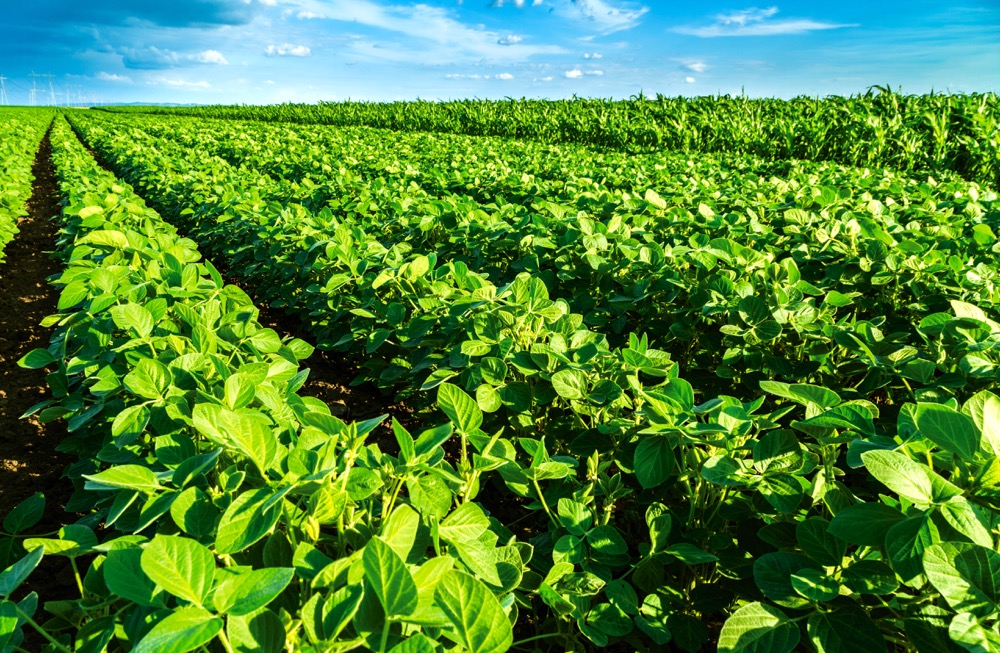
Soybeans
U.S. soybean stocks as of March 1 2018 were estimated at 2.1 billion bushels, which was above the average pre-report trade estimate of two billion bushels and above 1.7 billion bushels on March 1 of 2017. This report confirms the 2017 production of 4.4 billion bushels and reinforces that the ending stocks for 2017-18 crop year will finish near 555 million bushels, which is a record high.
There is no shortage of soybean supplies in the U.S. The acreage number was considered constructive for the soybean complex. U.S. farmers intend to plant 89 million acres of soybeans, which was on the low side of pre-report estimates ranging from 89.9 to 92.1 million. This was a surprise to the trade because most participants were expecting acreage to come in above last year’s seeded area of 90.1 million acres.
The U.S. is contending with a record carryout, but for 2018-19 it appears we’ll see a marginal tightening of the fundamental structure. After the report, new crop futures gained on old crop. The combined influence of the stocks and acreage report was constructive for the soybean market although more friendly for the new crop months.
The July November soybean futures spread has been trading at a 10 cent per bushel inverse, but this spread will likely move into a 10 cent carry.
For Ontario farmers, this will pressure the nearby basis and be supportive for new crop basis levels. When the futures market is inverted (the old crop trading at a premium to new crop), the market is telling farmers to sell now for immediate delivery. Don’t hold stocks into the new crop year.
While farmers are focused on production implications, traders are also incorporating potential changes to the world soymeal flows. Argentina is the largest soymeal exporter and drier conditions have resulted in a sharp year-over-year decrease in production. This has resulted in additional offshore demand for U.S. soymeal and contributed to the stronger crush margins in the U.S. and Canada.
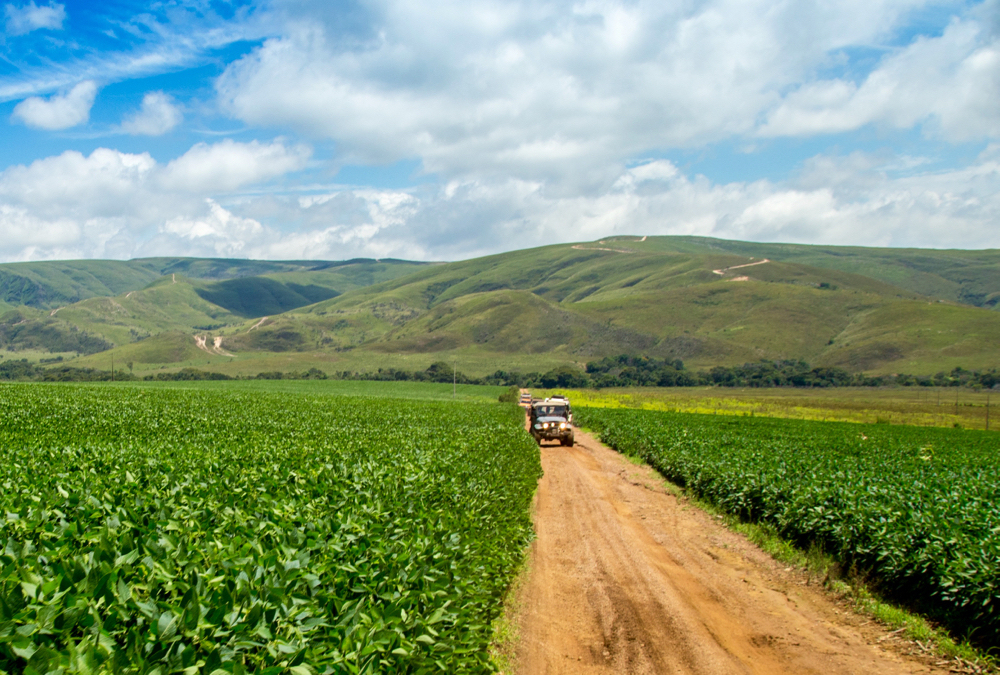
Brazil’s soybean harvest is approximately 65 per cent complete and crop estimates are ranging from 115 to 118 million tonnes. The larger Brazilian crop will result in lower U.S. and Canadian soybean exports to China. The export pace will slow down in the latter half of the crop year, so this also reinforces ideas to sell now, instead of later in summer.
Statistics Canada will release its seeding intentions report April 27. Traders are expecting Ontario soybean plantings to experience a year-over-year increase of five per cent to 10 per cent. Should trend yields materialize, we’ll see less imports from the U.S. during the first half of the crop year and the Ontario market will be saturated. If you are planning to deliver off the combine, the market is telling you to lock in a basis now, rather than wait. Look to price this basis on a weather-related rally later in summer.
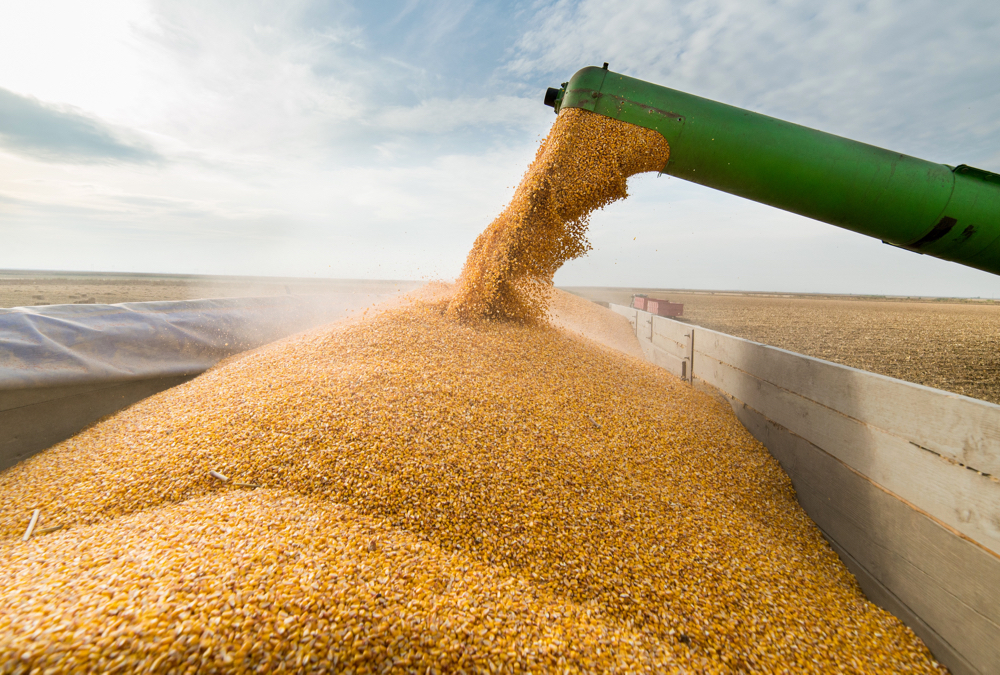
Corn
U.S. farmers intend to plant 88 million acres of corn in 2018, which is down from the 2017 seeded area of 90.2 million acres and below pre-report estimates ranging from 88.4 to 91 million acres.
Initially, this is very bullish for the corn market. Given the lower acreage, the market needs to experience near perfect seeding and growing conditions across the Midwest. If trend yields do not materialize, the U.S. fundamental structure becomes rather snug for the 2018-19 crop year.
The market is going to incorporate a risk premium due to the uncertainty in production. The bulk of the Midwest will experience below normal temperatures during the first half of April, which will delay seeding. There is a higher probability that the crop will move through the critical pollination stage during the warmer temperatures during the last half of July.
We’re going to see extreme volatility moving forward because the futures market will be very sensitive to weather. Looking at past years, the market usually makes a seasonal high in mid to late July so farmers will want to put this in their notebook as a potential pricing opportunity for new crop sales off the combine. The USDA estimated March 1 corn stocks at 8.9 billion bushels, which was on the high side of pre-report estimates ranging from 8.5 to 8.9 billion bushels. (Last year’s March 1 stocks were 8.6 billion bushels.) Feed usage may be trimmed on the April WASDE report but traders are anticipating an increase in exports which is the main factor driving the market.
Argentina’s crop estimates range from 30 to 32 million tonnes, down from the USDA estimate of 36.0 million tonnes and 2017 production of 41 million tonnes. Brazil’s second crop corn has experience favourable conditions and is in the vegetative stage. The critical period for the Safrinha corn crop is in late April and May.
Larger than expected U.S. stocks are negative for the Ontario corn basis. The Argentine corn harvest is in full swing and despite the smaller crop, we’ll see exports pick up over the next month. The Ontario cash market will come under pressure so farmers want to take advantage of the higher futures by selling old crop stocks.
There is a small carry between May and July so the market is telling farmers to sell now, for June and July delivery. Ontario corn acreage is expected to be unchanged from year-ago levels.
Wheat
The USDA report was considered boring for the wheat market because there were no surprises. The seeded acreage for the winter wheat classes were relatively unchanged from the January estimates.
Soft red winter wheat acres were estimated at 5.9 million, up from the 2017 seeded area of 5.7 million acres; hard red winter wheat acres were estimated at 23.2 million, down from year-ago area of 23.4 million. Hard red spring acres were estimated at 12.1 million, up from 10.5 million last year.
Prices for soft red winter wheat out of the Gulf are the most competitive on the world market at this time. Therefore, there is limited downside in the futures market. Secondly, when U.S. corn stocks become tight, we usually see more soft red and hard red wheat used as feed in the U.S. This is more important for new crop as corn stocks are quite large for old crop.
For old crop, the Chicago futures market is reflecting a 17 cent per bushel spread between the May and July futures. If you are looking to sell old crop, the market is telling farmers to sell now for July delivery. For new crop, if storage isn’t an issue, wait for a rally in the corn during the summer and then soft red winter wheat in July for November or December delivery.
The main driver in the wheat complex will be the hard red winter. Keep in mind the old crop stocks are quite burdensome and the fundamental structure will only tighten in the latter half of the 2018/19 crop year. This is the crop you probably want to store. Remember that farmers sell half of the U.S. hard red winter wheat in June and July.
For the week ending April, the USDA rated 32 per cent of the winter wheat crop in the good to excellent category, down from 51 per cent last year. Seasonal rains are in the forecast for Kansas during the last half April but the crop has suffered yield deterioration in Kansas, Texas and Oklahoma.
We’ll see a significant tightening of U.S. hard red winter wheat stocks. Without going into detail, the spring wheat market is bearish from current levels because of the year-over-year 15 per cent increase in seeded area. At this stage, The Russian wheat crop is projected to be down 8 to 10 million mt from last year.