(Resource News International) — Most grain and oilseed production estimates were raised from August levels in Statistics Canada’s latest crop production survey, released Friday, but market participants expect even further increases in the agency’s December update.
“The trade knows that the production numbers released by the government agency are not a true reflection of the situation,” said Mike Jubinville, an analyst with ProFarmer Canada in Winnipeg.
StatsCan’s survey was conducted in early September and thus did not reflect the benefits of the warm weather during the past month, said Jerry Klassen, a grains analyst and private commodity trader.
Read Also
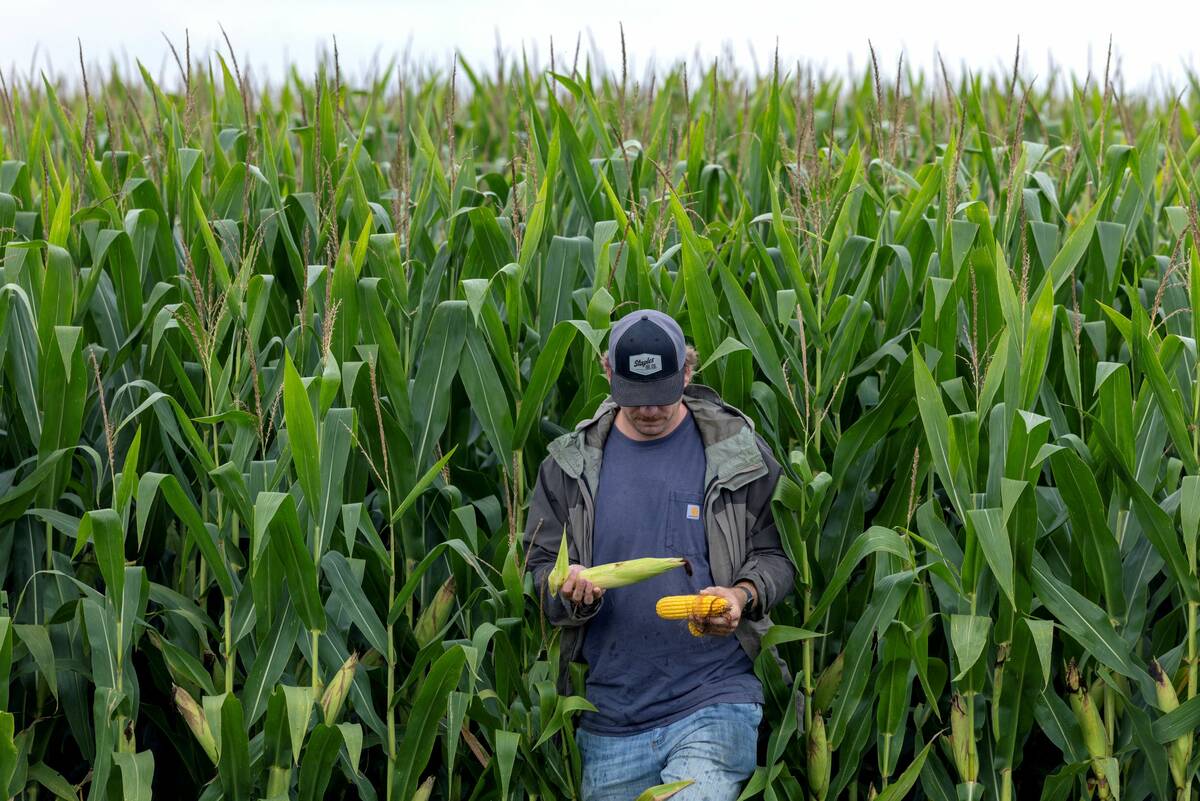
The U.S. corn crop could be the biggest ever. That’s terrible news for America’s farmers.
The USDA predicts a record corn crop for U.S. farmers, who question the agency’s accuracy amidst high debt and low crop prices.
“The market is going to have a hard time overcoming the expectation that the size of the grain and oilseed crops in Canada can only grow further,” Jubinville said.
Of the numbers in Friday’s report, the most surprising was seen to be the estimate for durum at 5.066 million tonnes. In its August report, the government agency had put Canada’s 2009-10 durum output at 4.519 million tonnes, while output in 2008-09 totalled 5.519 million.
“The number for durum may be lower than the year-ago level, but that is a very huge number,” Klassen said.
With the large durum crop, Jubinville said, Canada is going to have a very difficult time in unloading those supplies onto the global market at a high price.
“We are just not going to be able to sell all the durum we have,” he said. Normally durum values trade at a premium to spring wheat prices, but with these kinds of durum stocks, that is very unlikely to occur anytime soon.
Canola up
StatsCan pegged 2009-10 Canadian canola output at 10.269 million tonnes, which compared with pre-report ideas that ranged from 10 million to 11.5 million tons. In August, the survey projected canola production at 9.541 million tonnes while in 2008-09, output totalled 12.642 million.
“We did not see the full size of the canola crop in the StatsCan numbers released today,” a private dealer said, not wanting his name used.
“The numbers in the Dec. 3 report will be at least one million tonnes higher than what the Oct. 2 report showed,” he said.
Jubinville concurred that canola yields in some parts of Western Canada have been “monstrous” and will need to be taken into account in future reports.
He acknowledged there were producers who suffered poor canola yields due to unfavourable weather during the growing season, but there was also a higher percentage of producers who were surprised at their yield results.
StatsCan’s 2009-10 spring wheat production estimate of 16.561 million tonnes was up from the August projection of 16.15 million and compares with the 2008-09 level of 18.404 million.
The full impact of the beneficial weather was also not seen in the spring wheat production forecast, and that output in the December report should see this number raised by a minimum of about half a million tonnes, Klassen said.
“Based on the feedback I am getting, producers in Manitoba and eastern Saskatchewan managed to pull in record spring wheat yields, which can only bolster the estimate down the road,” he said.
StatsCan’s 2009-10 barley production estimate of 9.164 million tonnes was seen as being neutral and within expectations. The federal statistics agency pegged barley output in August at 8.948 million tonnes and in 2008-09 the crop size was 11.781 million.
Here, too, the private dealer felt the number in the next report will be higher.
The oat production estimate from Statistics Canada of 2.899 million tonnes was also considered a bit surprising, in that the figure was actually lowered and not raised. StatsCan in its August report pegged oats output in Canada at 2.967 million tonnes, while in 2008-09 it totalled 4.272 million.
“This number was seen as a bit contrary to the reports of strong yields, and will have to be watched closely in the upcoming report,” Jubinville said.
Klassen agreed that the number will likely be higher by the time the government agency releases its December report.
Table 1. Statistics Canada’s estimates and pre-report ideas for 2009-10 Canadian production, in millions of tonnes.
| StatsCan | StatsCan | |||
| Trade | Sept. | July | StatsCan | |
| estimates | 2009-10 | 2009-10 | 2008-09 | |
| Canola | 10.00-11.50 | 10.269 | 9.541 | 12.642 |
| All wheat | 25.00-27.00 | 24.580 | 23.614 | 28.611 |
| Barley | 9.50-9.70 | 9.164 | 8.948 | 11.781 |
| Oats | 3.00-3.30 | 2.899 | 2.967 | 4.272 |
| Peas | 3.40-3.50 | 3.161 | 3.113 | 3.571 |
| Flaxseed | 1.00-1.10 | 0.964 | 0.915 | 0.861 |