(Resource News International) — The main surprise in the updated grain and
oilseed production survey from Statistics Canada, released Thursday,
is that production levels for five major crop varieties were
lowered.
Mike Jubinville, a farm consultant with ProFarmer Canada
in Winnipeg, said, “It’s a surprise across the board.
I don’t get the sense that the trade had been anticipating a
fall in nearly everything to basically the bottom end or lower
end of trade expectations.”
But Ron Frost, a farm consultant with Pike Management in
Read Also
Mail strike disrupts grain sample delivery
The Canadian Grain Commission has asked farmers to consider delivering harvest samples directly to CGC offices, services centres or approved drop offs as Canada Post strike delays mail.
should not have been entirely surprising.
“All in all this is
just a realization of the damage that was done this summer by
the heat and the smaller yields are more than to be expected
than if we had turned around and bounced back. The numbers are
heading in the right direction although the degree of the
movement may be a little bit of a surprise,” he said.
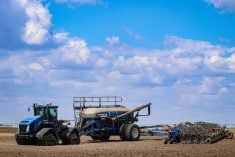
The numbers for StatsCan’s estimates came from its annual November survey of 31,500 farmers, conducted between Oct. 26 and Nov. 19.
Statistics Canada estimated 2007-08 (Aug-July) Canadian
canola production at 8.750 million tonnes. Pre-report
estimates ranged between 8.864 million and nine million tonnes.
Statistics Canada in October estimated the production of the
2006-07 totalled nine million.
“The canola number is not going to have a big
immediate impact because the supply is not a big issue,” said broker Ken Ball of Union Securities in Winnipeg. “But
ultimately somewhere down the road canola supplies are going
to tighten up and 100,000 tonnes of canola is going to have a
supportive effect.”
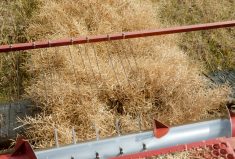
Barley production levels for 2007-08 were lowered to
10.983 million tonnes, down from the Oct. 4 estimate of
11.822 million tonnes. Pre-report estimates for barley ranged
from 11.5 million to 12 million tonnes. The Canadian
barley production level for 2006-07 was 9.573 million tonnes.
“Everything was lowered with few exceptions but the one
that stands out is barley,” Ball said. “The market is already
production like that is certainly going to affect the numbers
game. Barley is projected to be very tight.”
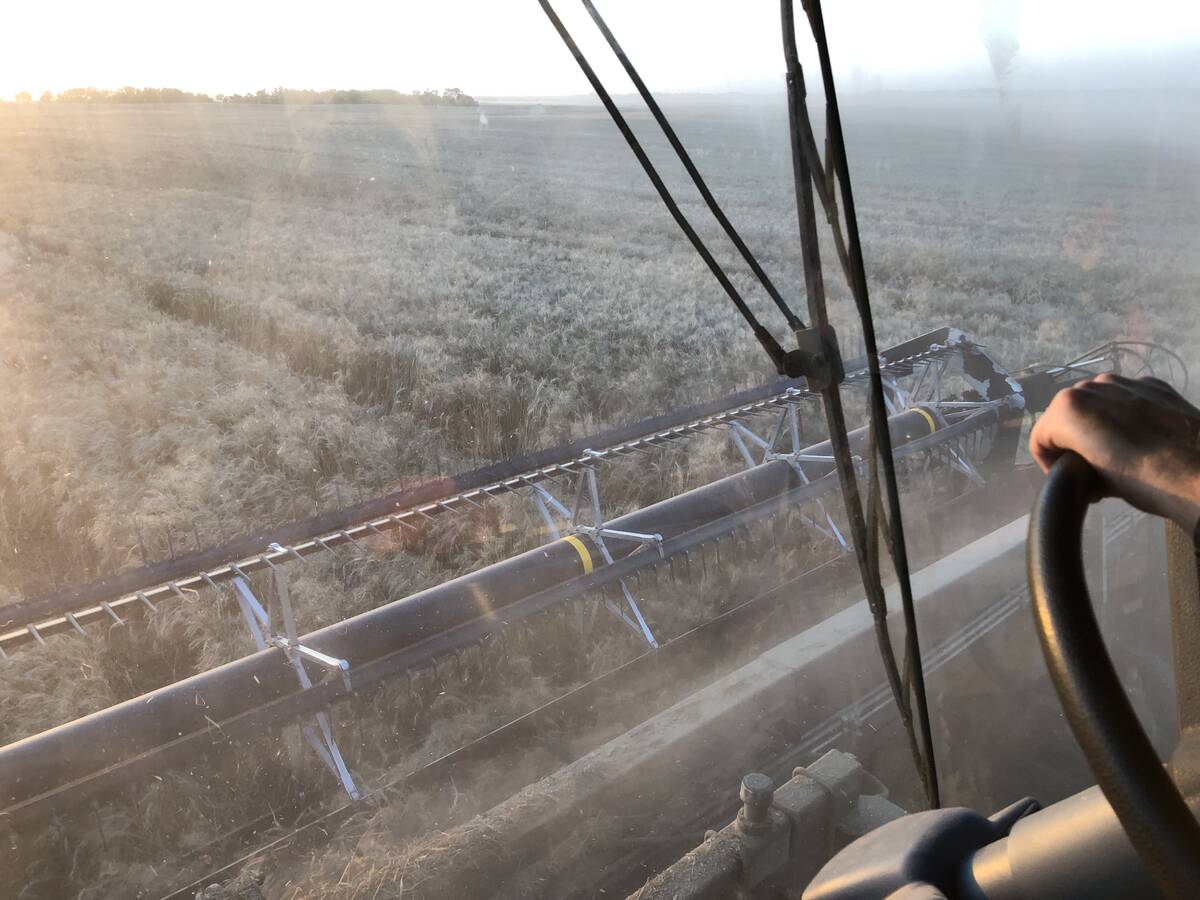
Jubinville added that harvest delays in Alberta
negatively affected yields across the board, but barley yields
in particular.
As far as oat production is concerned, Frost originally
estimated production at 4.900 million tonnes. He was surprised
by the amount of the decline but felt this was the correct
direction in terms of production levels.
The updated report estimated 2007-08 oat production
levels at 4.696 million tonnes. Pre-report estimates ranged from
4.9 million to 5.2 million tonnes. The Oct. 4 estimate
placed the level at 5.009 million. This compares with the
2006-07 level of 3.852 million.
Flaxseed production levels were also lowered in the final
report. The Dec. 6 estimates for flaxseed production is
million tonnes. The flaxseed production level for the 2006-07
crop year was 0.989 million tonnes.
All-wheat production levels for 2007-08 were
lowered to 20.054 million tonnes from an earlier Oct. 4
forecast of 20.641 million. Pre-report estimates ranged from
20 million to 20.75 million tonnes. The 2006-07 all-wheat
production number was 25.265 million tonnes.
Results from Statistics Canada’s Oct. 26-Nov. 19 survey (released Dec. 6) compared to StatsCan 2007-08 estimates from Oct. 4 and 2006-07 final results, plus trade estimates made ahead of the Dec. 6 release.
| Trade | StatsCan | StatsCan | StatsCan | |
| estimates | Nov. 19 | Oct. 4 | 2006-07 | |
| 2007-08 | 2007-08 | |||
| Canola | 8.864 – 9.000 | 8.750 | 8.864 | 9.000 |
| All wheat | 20.000 – 20.750 | 20.054 | 20.641 | 25.265 |
| Barley | 11.500 – 12.000 | 10.983 | 11.822 | 9.573 |
| Flaxseed | 0.600 – 0.625 | 0.633 | 0.625 | 0.989 |
| Oats | 4.900 – 5.200 | 4.696 | 5.009 | 3.852 |