

MarketsFarm — There were a few tweaks to the old-crop data in the April supply/demand report from the International Grains Council (IGC) on Thursday — but somewhat more significant numbers for its new-crop projections.
For the 2021-22 crop year, the IGC bumped up total global grain production by three million tonnes at 2.287 billion tonnes, compared to its March report. For the coming year, the council projected total world production to slip about 0.5 per cent at 2.275 billion tonnes.
The IGC cited uncertainties in crop production due to the war in the Ukraine and reduced output in South America, countered by increased production in Asia.
Read Also
CBOT Weekly: April supply and demand report a ‘nothing burger’
There was very little change in the April supply and demand estimates from the United States Department of Agriculture on April 9, with the report essentially being a carbon copy of the March estimates.
The council added three million tonnes of total global consumption for the current year, now at 2.281 billion tonnes. It raised it further to 2.302 billion tonnes for the coming crop year. While world ending stocks nudge up by one million tonnes at 608 million, they are expected to fall back 4.4 per cent in 2022-23 at 581 million.
Global wheat saw few notable changes, with total consumption set to rise 0.9 per cent in 2022-23 at 785 million tonnes. In turn that’s to generate a 1.8 per cent drop in ending stocks, at 277 million tonnes.
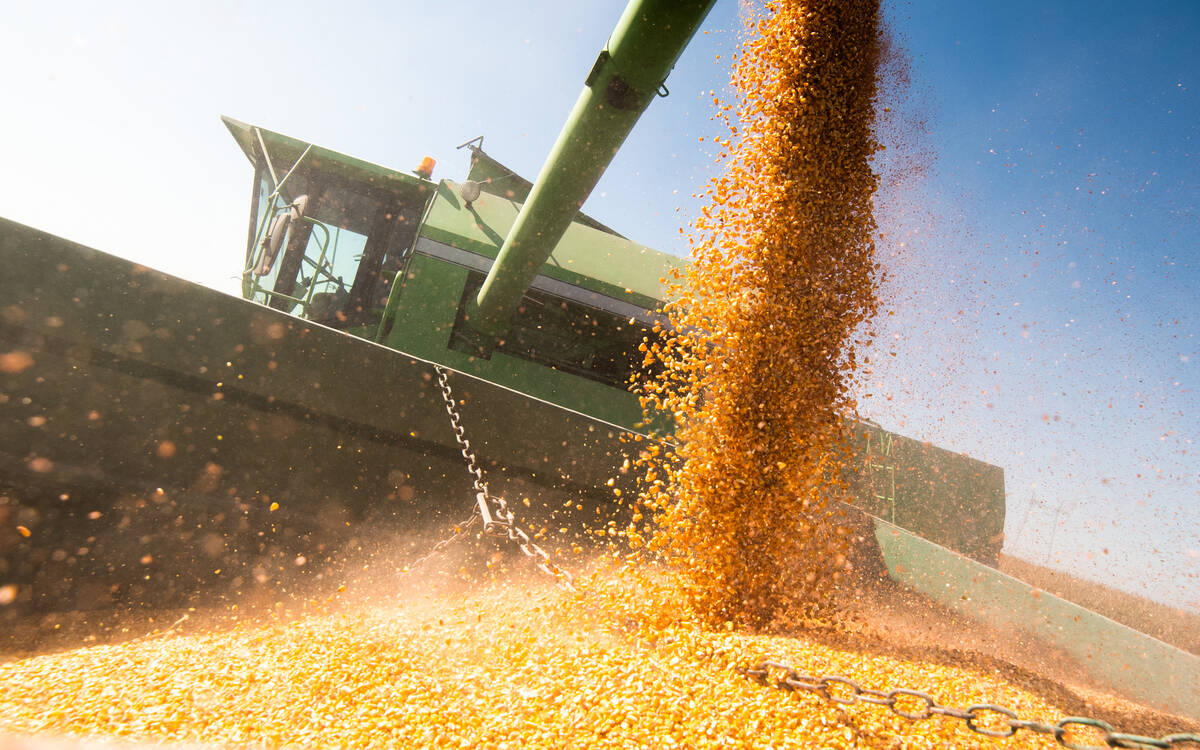
The IGC’s projections for corn were somewhat more pronounced for the new crop year. While global corn production in 2022-23 was projected to slip almost 1.1 per cent at 1.197 billion tonnes, consumption is to increase 1.4 per cent at 1.218 billion. That will drop ending stocks 7.3 per cent in 2022-23, to 265 million tonnes.
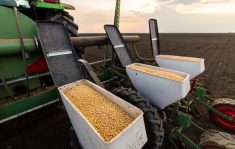
Soybeans also had some significant changes, with the IGC raising world production by 9.7 per cent in 2022-23 to 383 million tonnes. Consumption was pegged to grow 3.6 per cent next year at 373 million tonnes, with the carryout to drop 7.3 per cent to 265 million tonnes.
Table: International Grains Council projections for old- and new-crop production, export, consumption and ending stocks as of April 21, 2022, in millions of metric tonnes. IGC March 2022 figures included for comparison.
| Total grains | March | April | 2022-23 |
| 2021-22. . | 2021-22 | ||
| Production | 2,284 | 2,287 | 2,275 |
| Trade | 415 | 416 | 407 |
| Consumption | 2,278 | 2,281 | 2,302 |
| Ending stocks. . | 607 | 608 | 581 |
| Wheat | March | April | 2022-23 |
| 2021-22 | 2021-22 | ||
| Production | 781 | 781 | 780 |
| Trade | 194 | 193 | 193 |
| Consumption | 778 | 778 | 785 |
| Ending stocks | 281 | 282 | 277 |
| Corn | March | April | 2022-23 |
| 2021-22 | 2021-22 | ||
| Production | 1,207 | 1,210 | 1,197 |
| Trade | 173 | 175 | 171 |
| Consumption | 1,197 | 1,201 | 1,218 |
| Ending stocks | 287 | 286 | 265 |
| Soybeans | March | April | 2022-23 |
| 2021-22 | 2021-22 | ||
| Production | 350 | 349 | 383 |
| Trade | 159 | 155 | 166 |
| Consumption | 362 | 360 | 373 |
| Ending stocks | 42 | 44 | 54 |