CNS Canada — Statistics Canada’s second attempt at using satellite imagery to determine the size of the country’s crops is in line with trade guesses when it comes to canola — but market participants are still taking the new methodology with a grain of salt.
The model-based principal field crop estimates, released Tuesday, are calculated according to a new approach, first introduced in 2015 by StatsCan.
The estimates are based on a model that incorporates coarse resolution satellite data from StatsCan’s crop condition assessments, data from the field crop reporting series, agro-climatic data and other sources.
Read Also

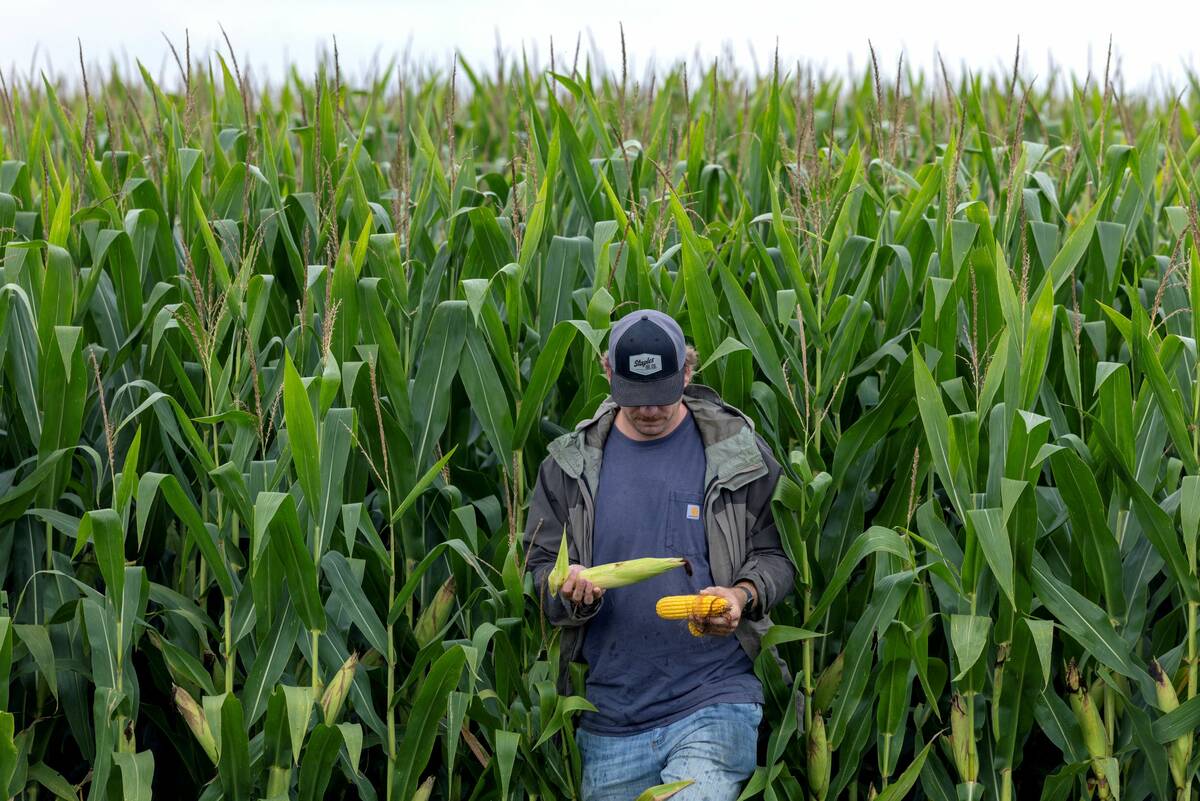
The U.S. corn crop could be the biggest ever. That’s terrible news for America’s farmers.
The USDA predicts a record corn crop for U.S. farmers, who question the agency’s accuracy amidst high debt and low crop prices.
“Nobody knows quite how to take these numbers,” said Ken Ball of PI Financial Corp in Winnipeg. The new canola production estimate, at 18.3 million tonnes, makes sense and is in the ballpark of what people were thinking, he said.
The previous survey-based estimate, released in August, pegged the 2016-17 canola crop at 17 million tonnes, which would compare with the 18.4 million grown in 2015-16.
That August number was generally thought to be understated, with most of the trade still of the opinion that actual canola production was in the 18 million- to 19 million-tonne range, said Mike Jubinville of ProFarmer Canada.
However, the new technology was four million tonnes short in 2015, pegging the canola crop at only 14 million tonnes in the September report.
As a result, “there is a bias in the mindset that whatever number StatsCan comes up with, and whatever way they calculate, it’s bigger still,” said Jubinville.
“It’s an experimental process” and requires adjustment under different conditions, Ball said of model-based estimates.
“The model may work beautifully under one set of growing conditions, and go all out of whack the next year under different conditions,” he said, adding it will likely take years to get enough confidence in the new methodology to substitute for actual survey results.
Looking at some of the other crops, Jubinville said the durum number sticks out. At 7.3 million tonnes, “it’s the biggest durum crop of all time.” While fusarium issues have downgraded the crop, he said the large supplies will take a long time to work down.
Lentils, oats, mustard and barley all saw downward revisions compared to the August survey.
— Phil Franz-Warkentin writes for Commodity News Service Canada, a Winnipeg company specializing in grain and commodity market reporting.
Table: Statistics Canada crop model-based production summary, released Sept. 20, 2016. Estimated production in thousand metric tonnes.
| Model-based. . | Survey-based | Survey-based | |
| estimates, | estimates, | estimates | |
| 2016-17 | August, 2016-17. . | 2015-16 | |
| Durum wheat | 7,311.5 | 6,806.6 | 5,388.7 |
| Spring wheat | 20,552.8 | 20,246.5 | 19,962.3 |
| Winter wheat. . | 3,457.0 | 3,433.6 | 2,243.1 |
| Oats | 2,873.9 | 3,018.1 | 3,427.7 |
| Barley | 8,401.8 | 8,704.3 | 8,225.7 |
| Flaxseed | 576.4 | 575.8 | 942.3 |
| Canola | 18,309.3 | 17,023.8 | 18,376.5 |
| Dry peas | 4,607.8 | 4,611.1 | 3,200.7 |
| Lentils | 2,830.5 | 3,233.8 | 2,540.5 |


